Introduction
Debugging is an essential part of the software development process. It helps to identify and fix bugs in the code or improve the performance of the app.
Android logcat allows us to view logs on an Android device or emulator. It’s a helpful tool for debugging because it provides detailed information about the state of the application and device at a given time. Recently, the new version of logcat was introduced. It is available from the Android Studio Dolphin (2021.3) as an experimental feature. The Android Studio Electric Eel (2022.1) includes a new logcat activated by default.
New logcat in the Android Studio Dolphin.
To enable a new logcat in the Android Studio Dolphin, we need to follow the following steps:
- Open Settings
- Go to the "Experimental" section
- Activate the "Enable new logcat window" item
- Restart Android Studio
Note: You cannot pause and resume a new logcat in the Android Studio Dolphin, but this feature is available in the Android Studio Electric Eel.
Top 5 features
This version of logcat includes not only a redesign but also improvements and new features which simplify reading logs and help to find required information faster. Plus, you can have multiple logcat windows inside the Android Studio.
Let’s check the most interesting features in a new release.
Additional logs when app starts and stops
The new logcat displays additional messages when the application starts or stops (closes or crashes).
Such memos include message, process ID and package name.
// application started
--- PROCESS STARTED (32485) for package com.alexzh.testapp ---

// application stopped
--- PROCESS ENDED (32354) for package com.alexzh.testapp ---
Queries
In the previous version of logcat, we had “search” on the main screen, but filters were located on a separate menu.

The main problem with this approach is that the filter parameters were always hidden from the developer.
In the new version, logcat combines the search and filter into the query input field and displays it on the main screen.

Let’s take a look at specific keys that can be used for filtering out log entries:
- Package
- Package of the local app:
package:mine - Package ID:
package:<package-ID>
- Package of the local app:
- Log level:
level:[VERBOSE | INFO | ASSERT | DEBUG | WARN | ERROR] - Tag:
tag:<tag>
When you filter by level, remember that level value in logcat will be greater than or equal to the query level value.
Examples:
- Query:
level:DEBUGdisplays logs forDEBUG,WARNandERRORlevel values- Query:
level:INFOdisplays logs forINFO,ASSERT,DEBUG,WARN, andERRORlevel values
Examples of using the specific values for filtering out the log entries.
Example: Show logs with WARN and ERROR levels.
Query: package:mine level:WARN

Example: Display logs which have the "HomeScreen" tag, and the message starts with "test log" text.
Query: package:mine tag:HomeScreen test log

To exclude log entries, you can use the "-" sign before key (-tag:<exclude-tag>).
Example: Show logs for all tags, which start with "HomeScreen" prefix and exclude logs for "HomeScreenSettings" tag.
Query: package:mine tag:HomeScreen -tag:HomeScreenSettings

If you want to use a regular expression in logs, you can use the "~" after the key (tag~:<regular-expression-tag>).
Example: Display logs which have a tag with the “Nav” postfix.
Query: package:mine tag~:.*Nav

We can filter logs by timestamp range by using the age:<number><unit> parameter.
age:30sreturns logs for the last 30 secondsage:2mreturns logs for the last 2 minutesage:1hreturns logs for the last hourage:2dreturns logs for the last 2 days
You can find all crashes and stack traces using the is key.
- The
is:crashreturns log entries that represent the crash - The
is:stacktracereturns log entries that represent anything that looks like Java stack trace
Query history
The latest version of the logcat has a few improvements to the "Query history". Now, we can delete queries from the history, mark queries as a favorite or set a specific name for a query.

The "Query history" feature allows to delete items by pressing "X" only in Android Studio Electric Eel (2022.1) or higher, but in Android Studio Dolphin you can use keyboard shortcut for it.
Every query filter also shows the number of found log entries.
Mark query as favorite
When we use different queries, the query history window will contain too many queries. To clean it up, we can mark the most usable queries as a favorite by clicking on the "star" icon at the end of the query input.

Remove query from history
You can easily remove a query by pressing the "X" icon of any query in the history or you can press SHIFT + DEL.

The "Query history" feature allows to delete items by pressing "X" only in Android Studio Electric Eel (2022.1) or higher, but in Android Studio Dolphin you can use keyboard shortcut for it.
Set name to a query
This feature works in Android Studio Electric Eel (2022.1) or higher.
When we have many queries in history, we need to analyze query before selecting the required one.
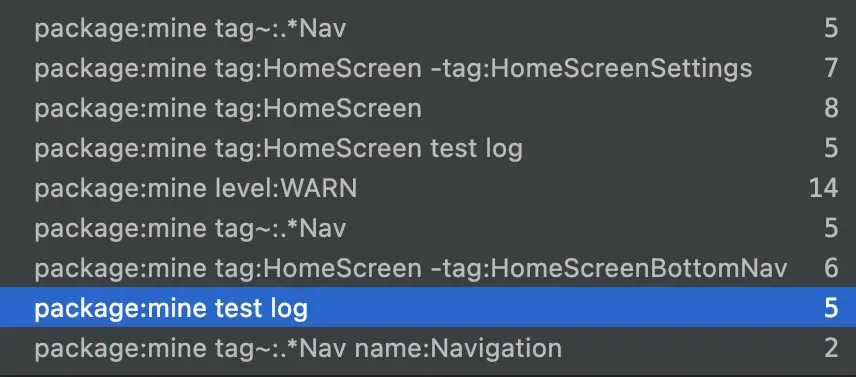
To avoid such a situation, we can assign a name to a query by adding the name:<name-of-the-query> to the query. After, the query history shows the name of the query instead of the query itself, but the query field will show all parts of the query.

Formatting
New logcat provides multiple two formatting options:
- Standard View
- Compact View
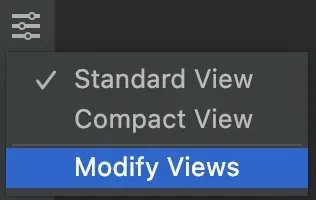
We can change the active view by clicking on the "Configure Logcat Formatting Options" icon on the left side of the logcat window.
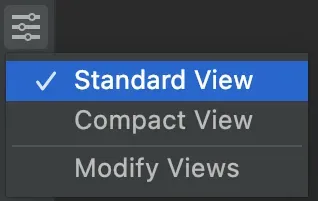
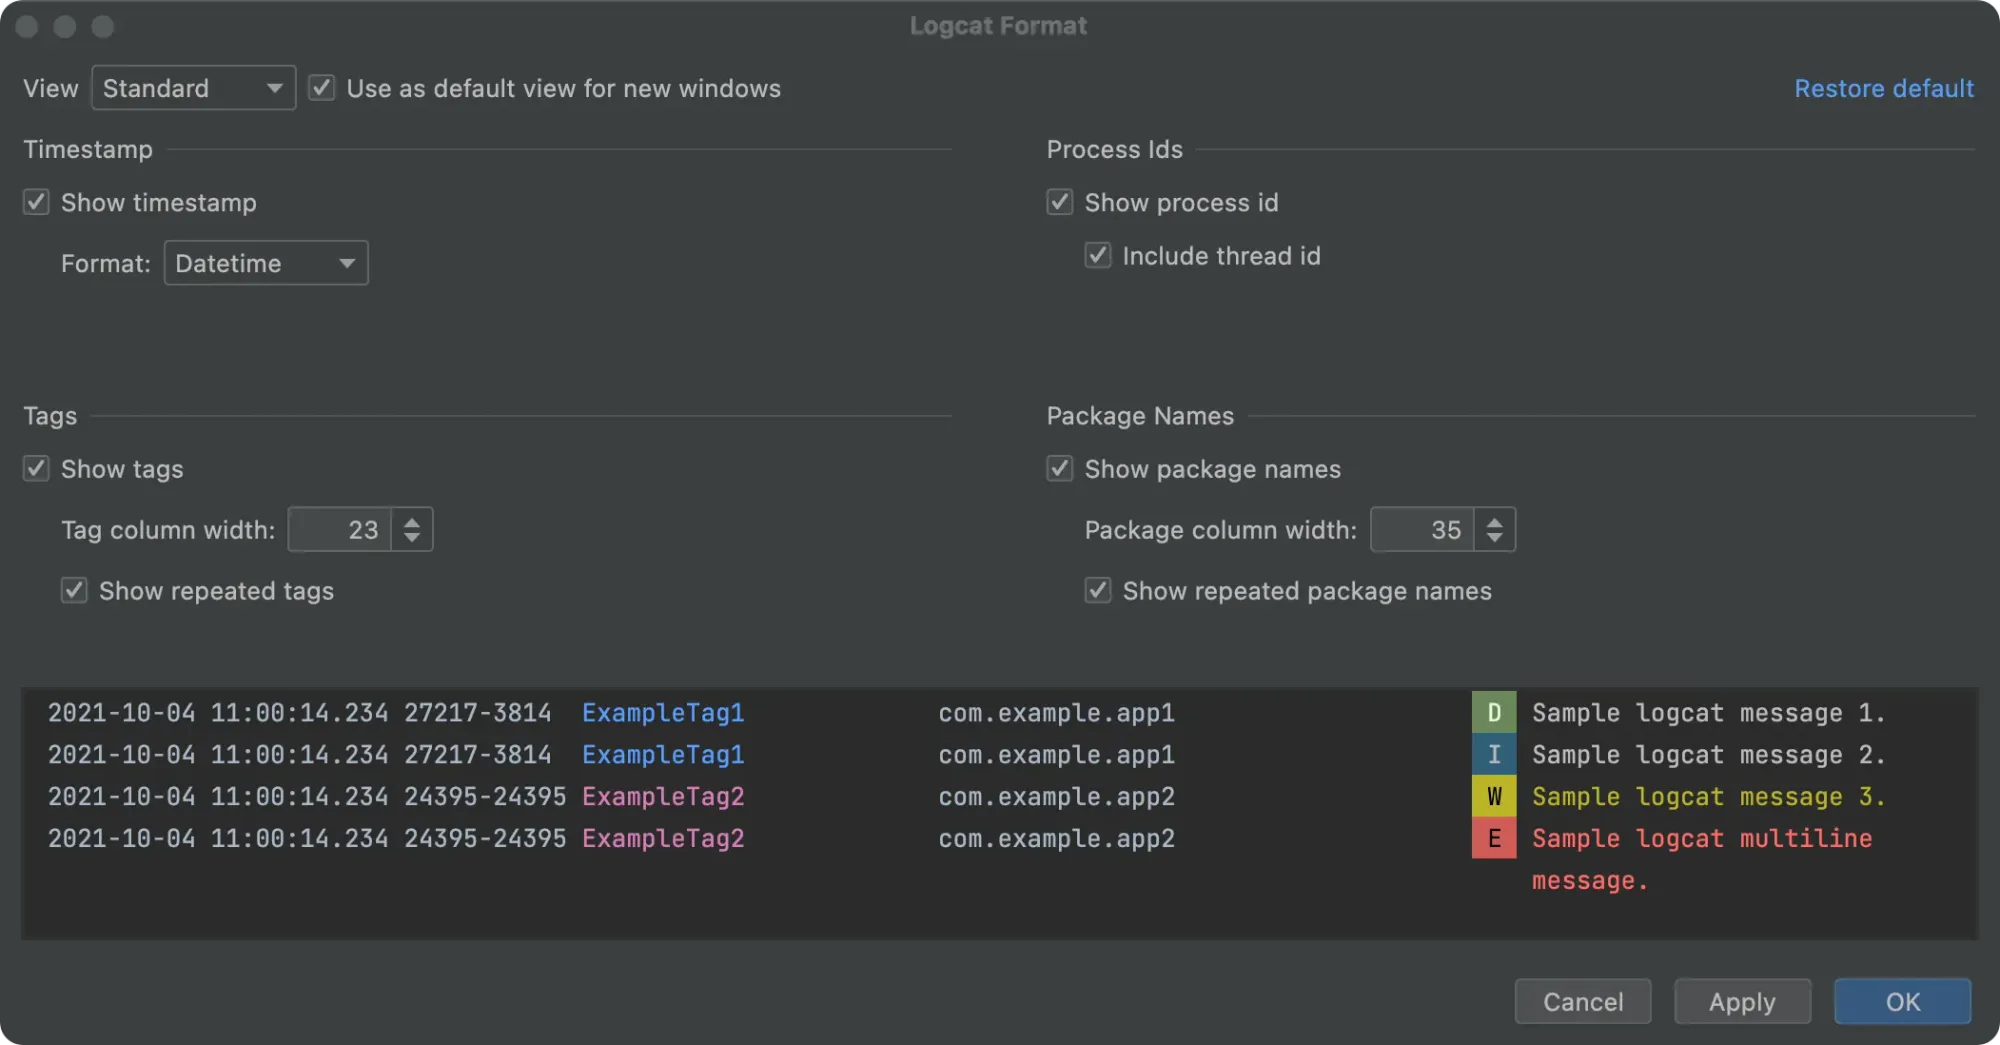
The "Standard View" shows all available information: timestamp (date & time), process ID (including thread ID), tags, package name, log level and message.
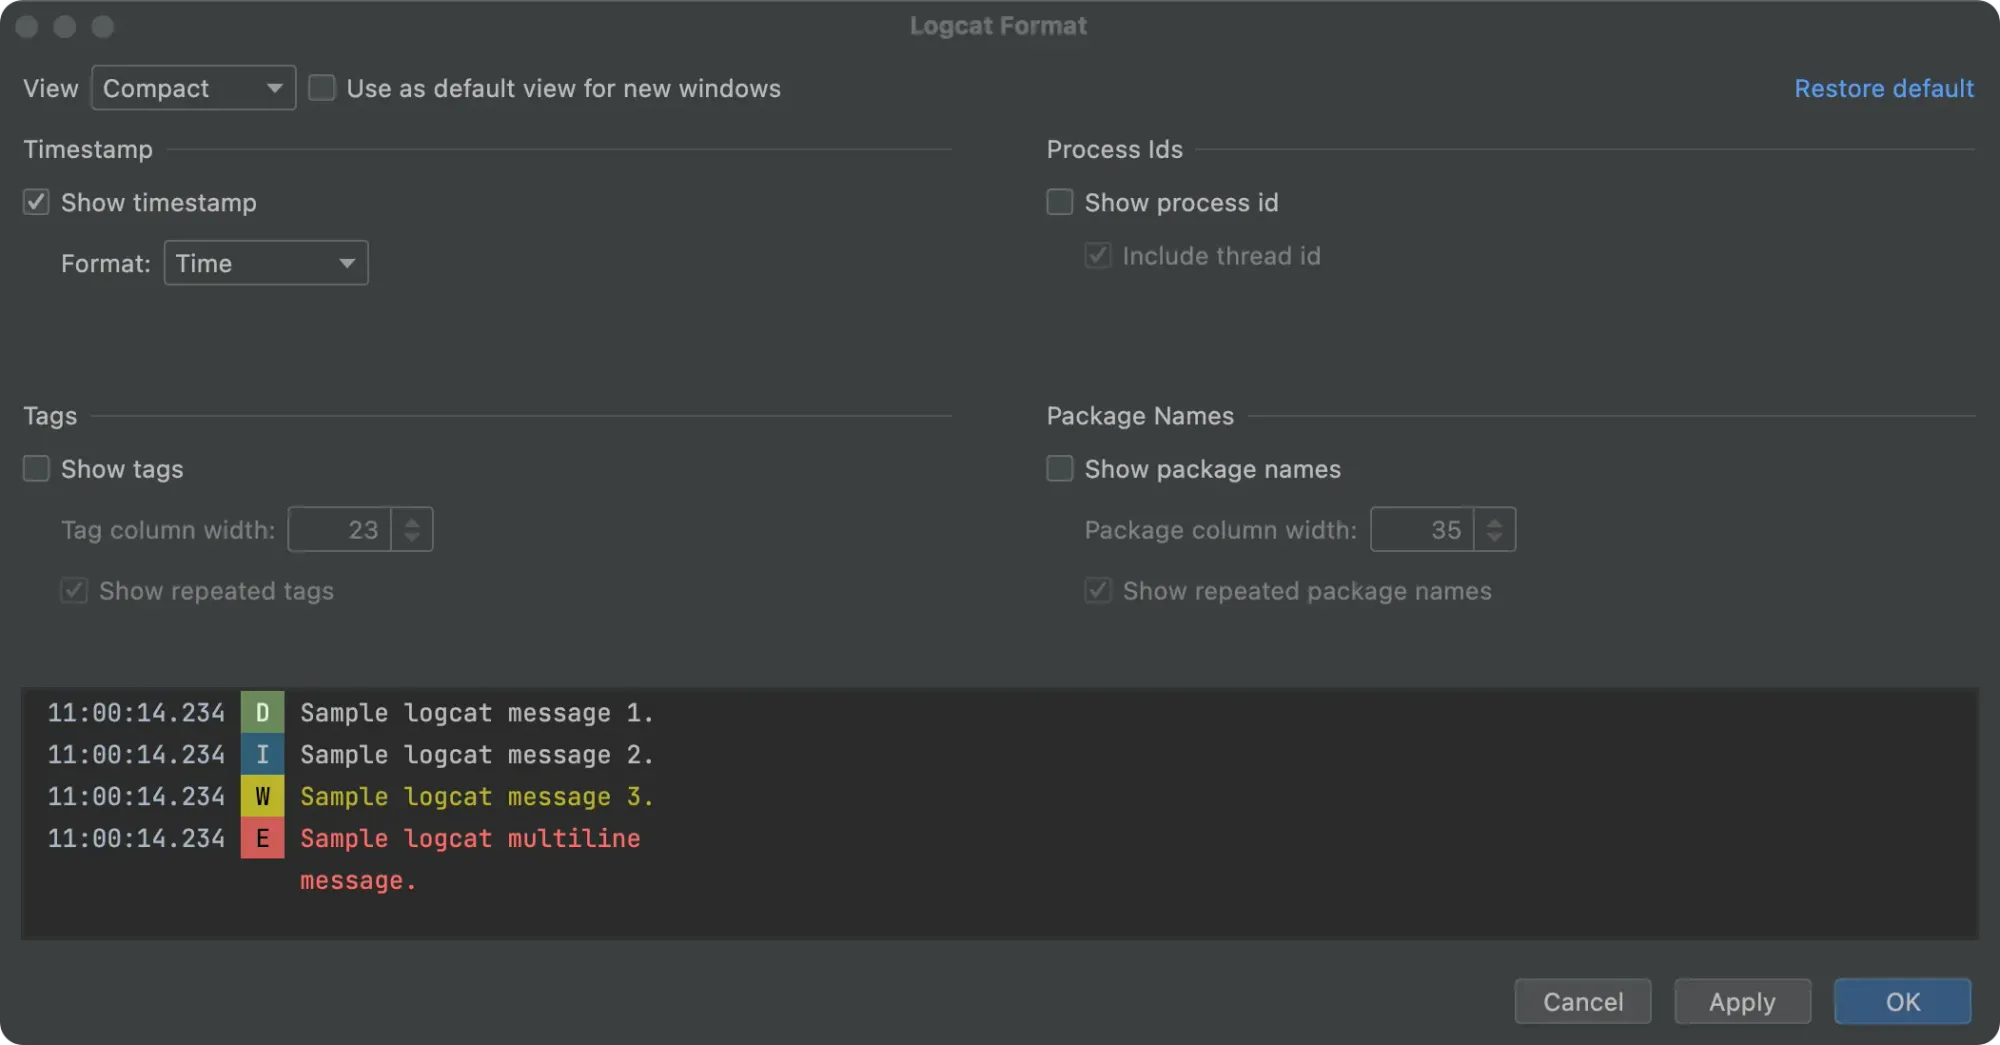
The "Compact View" displays the timestamp (time), log level and message.
To change both predefined views, we need to click on the "Configure Logcat Formatting Options" icon and select "Modify View". All changes will be applied to the selected view.
Based on my tasks, I usually use timestamp (time format), tag, and message. After spending a minute to configuring it, logcat now looks much cleaner.

Multiple logcat windows
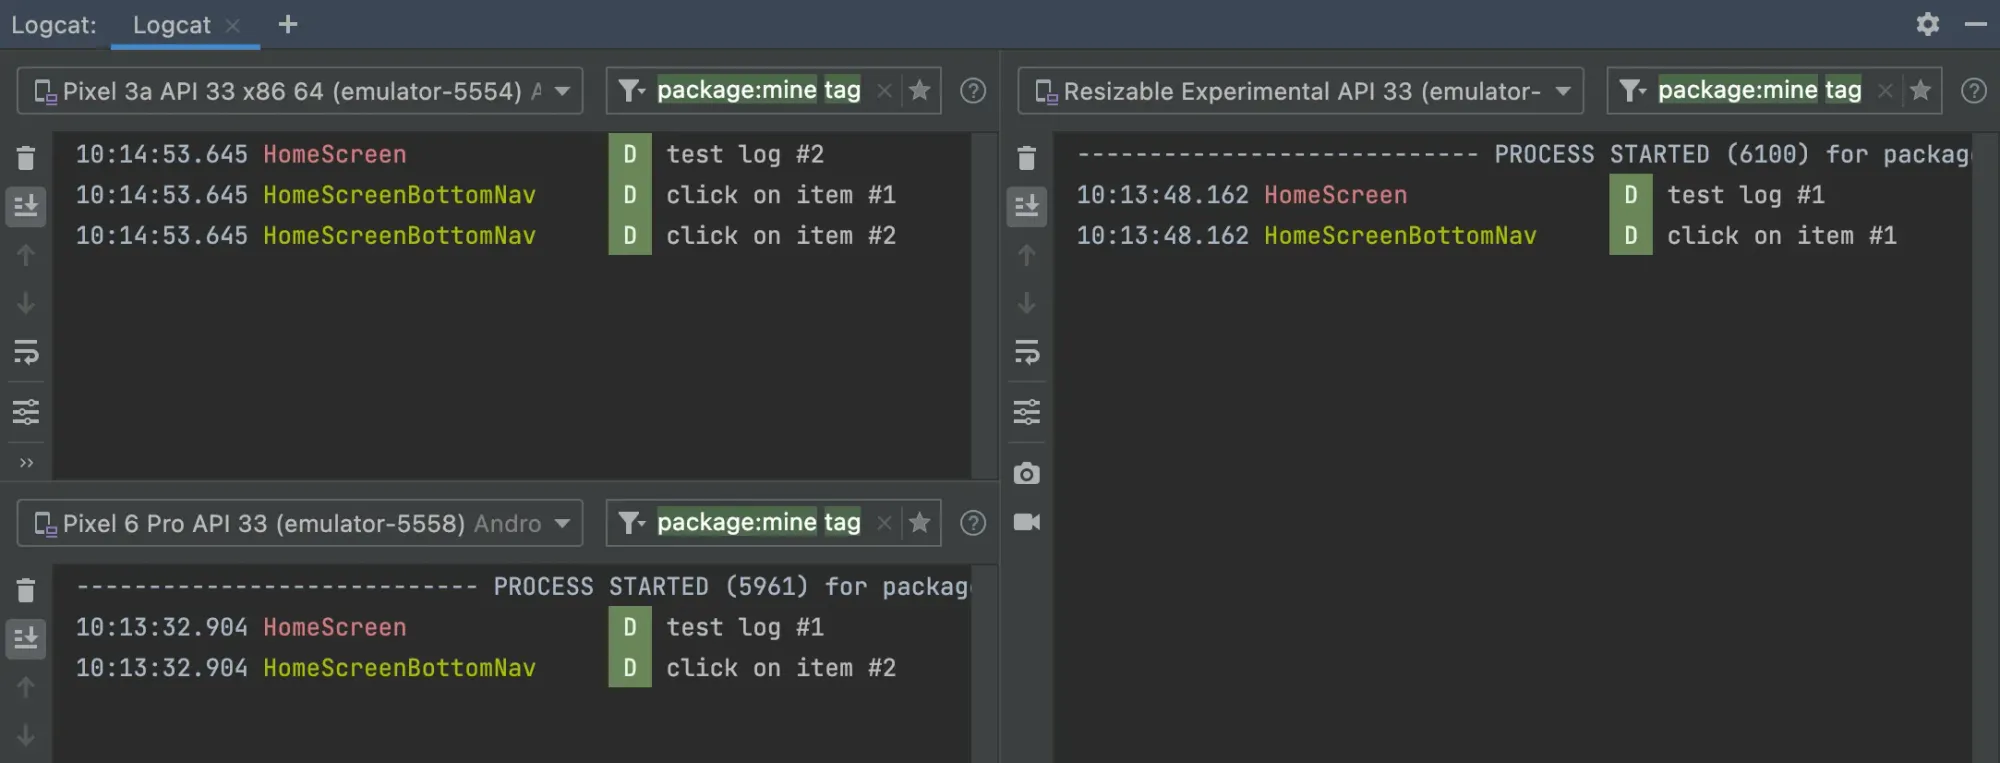
We can create as many logcat tabs as we need by pressing the "New tab" icon.
Every tab allows multiple logcat windows. It can be helpful if you want to use different queries for every panel or check logs for different devices. We can split the logcat window into two by right clicking on the logs and selecting "Split Right" or "Split Down".
Conclusion
The new version of logcat in Android Studio has a new UI and polished existing features, with the introduction of a few new ones. I hope to see even more improvements in the future.
Top 5 features:
- Additional logs when the application starts, stops or crashes
- Multiple logcat tabs and windows allow the user to analyze data from different devices simultaneously
- Formatting options of log entries can be adjusted and we can see only the necessary information
- Search and filters were merged into the query input field, which is always visible, also including additional filter operators like
is:crush, exclusive operators (-tag:<exclude-a-tag>) and much more - Most usable queries can be saved as a favorite, and you have more control over query history.

